Data Pre Processing
Data Pre Processing
2 minute read
Real World 🌎 Data
Messy and Incomplete.
We need to pre-process the data to make it:
- Clean
- Consistent
- Mathematically valid
- Computationally stable
👉 So that, the machine learning algorithm can safely consume the data.
Missing Values
- Missing Completely At Random (MCAR)
- The missingness occurs entirely by chance, such as due to a technical glitch during data collection or a random human error in data entry.
- Missing At Random (MAR)
- The probability of missingness depends on the observed data and not on the missing value itself.
- e.g. In some survey, the age of many females are missing, because they may not like to disclose the information.
- Missing Not At Random (MNAR)
- The probability of missingness is directly related to the unobserved missing value itself.
- e.g. Individuals with very high incomes 💰may intentionally refuse to report their salary due to privacy concerns, making the missing data directly dependent on the high income 💰value itself.
Handle Missing Values (Imputation)
- Simple Imputation:
- Mean: Normally distributed numerical features.
- Median: Skewed numerical features.
- Mode: Categorical features, most frequent.
- KNN Imputation:
- Replace the missing value with mean/median/mode of ‘k’ nearest (similar) neighbors of the missing value.
- Predictive Imputation:
- Use another ML model to estimate missing values.
- Multivariate Imputation by Chained Equations (MICE):
- Iteratively models each variable with missing values as a function of other variables using flexible regression models (linear regression, logistic regression, etc.) in a ‘chained’ or sequential process.
- Creates multiple datasets, using slightly different random starting points.
Handle Outliers 🦄
🦄 Outliers are extreme or unusual data points, can mislead models, causing inaccurate predictions.
- Remove invalid or corrupted data.
- Replace (Impute): Median or capped value to reduce impact.
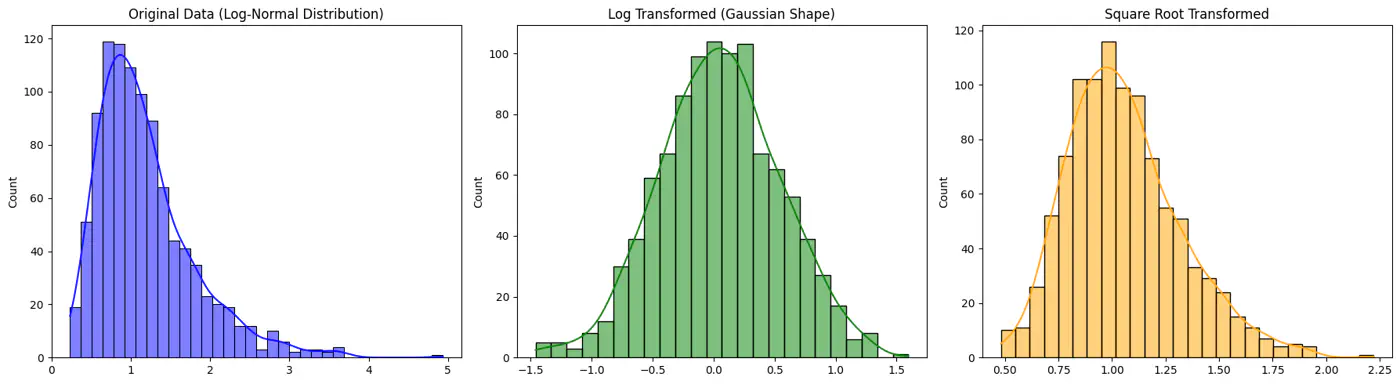
- Transform: Apply log or square root to reduce skew.
👉 For example: Log and Square Root Transformed Data
Scaling and Normalization
💡 If one feature ranges from 0-1 and another from 0-1000, larger feature will dominate the model.
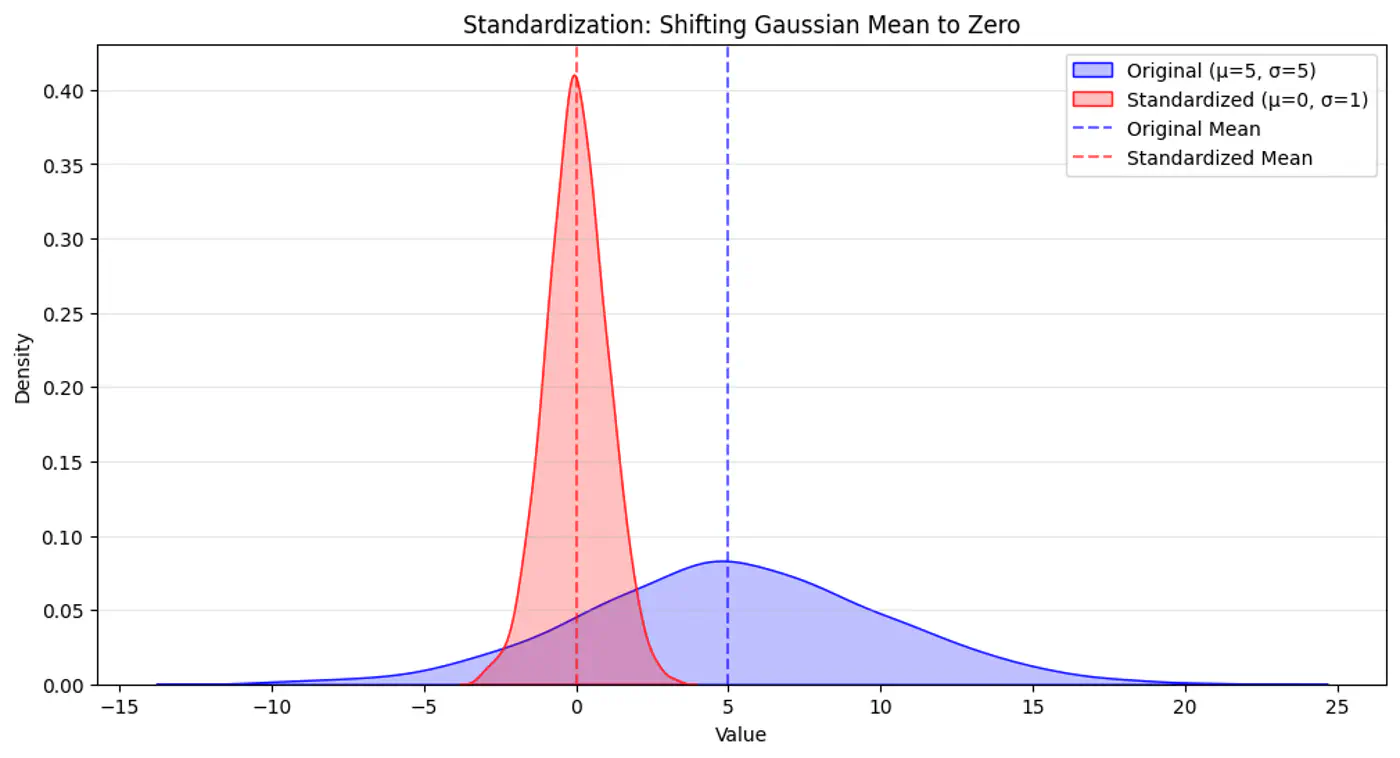
- Standardization (Z-score) :
- μ=0, σ=1; less sensitive to outliers.
- \(x_{std} = (x − μ) / σ\)
- Min-Max Normalization:
- Maps data to specific range, typically [0,1]; sensitive to outliers.
- \(x_{minmax} = (x − min) / (max − min)\)
- Robust Scaling:
- Transforms features using median and IQR; resilient to outliers.
- \(x_{scaled}=(x-\text{median})/\text{IQR}\)
👉 Standardization Example
End of Section