Data Pre Processing
Data Pre Processing
2 minute read
Real World Data
Messy and Incomplete.
We need to pre-process the data to make it:
- Clean
- Consistent
- Mathematically valid
- Computationally stable
👉 So that, the machine learning algorithm can safely consume the data.
Missing Values
- Missing Completely At Random (MCAR)
- The missingness occurs entirely by chance, such as due to a technical glitch during data collection or a random human error in data entry.
- Missing At Random (MAR)
- The probability of missingness depends on the observed data and not on the missing value itself.
- e.g. In some survey, the age of many females are missing, because they may not like to disclose the information.
- Missing Not At Random (MNAR)
- The probability of missingness is directly related to the unobserved missing value itself.
- e.g. Individuals with very high incomes may intentionally refuse to report their salary due to privacy concerns, making the missing data directly dependent on the high income value itself.
Handle Missing Values (Imputation)
- Simple Imputation:
- Mean: Normally distributed numerical features.
- Median: Skewed numerical features.
- Mode: Categorical features, most frequent.
- KNN Imputation:
- Replace the missing value with mean/median/mode of ‘k’ nearest (similar) neighbors of the missing value.
- Predictive Imputation:
- Use another ML model to estimate missing values.
- Multivariate Imputation by Chained Equations (MICE):
- Iteratively models each variable with missing values as a function of other variables using flexible regression models (linear regression, logistic regression, etc.) in a ‘chained’ or sequential process.
- Creates multiple datasets, using slightly different random starting points.
Handle Outliers
🦄 Outliers are extreme or unusual data points, can mislead models, causing inaccurate predictions.
- Remove invalid or corrupted data.
- Replace (Impute): Median or capped value to reduce impact.
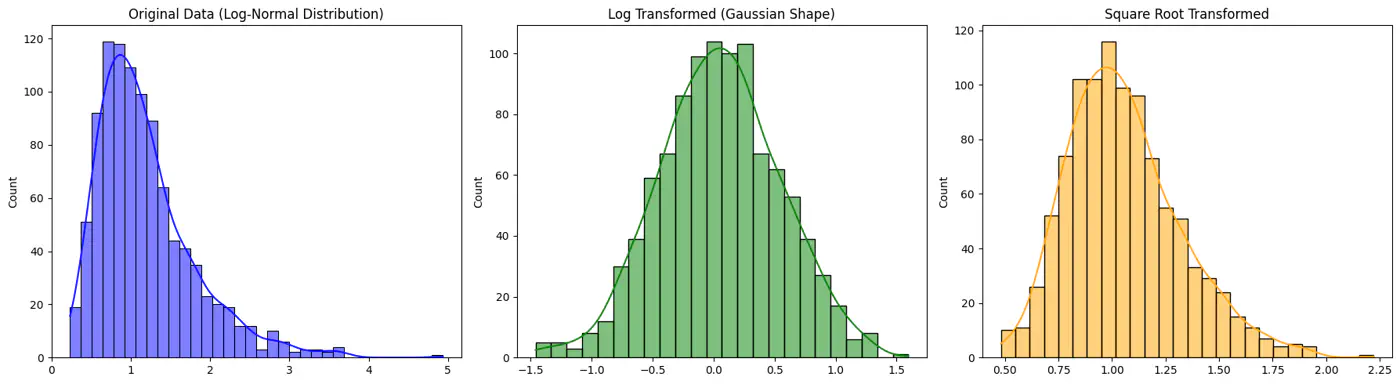
- Transform: Apply log or square root to reduce skew.
👉 For example: Log and Square Root Transformed Data
Scaling and Normalization
💡 If one feature ranges from 0-1 and another from 0-1000, larger feature will dominate the model.
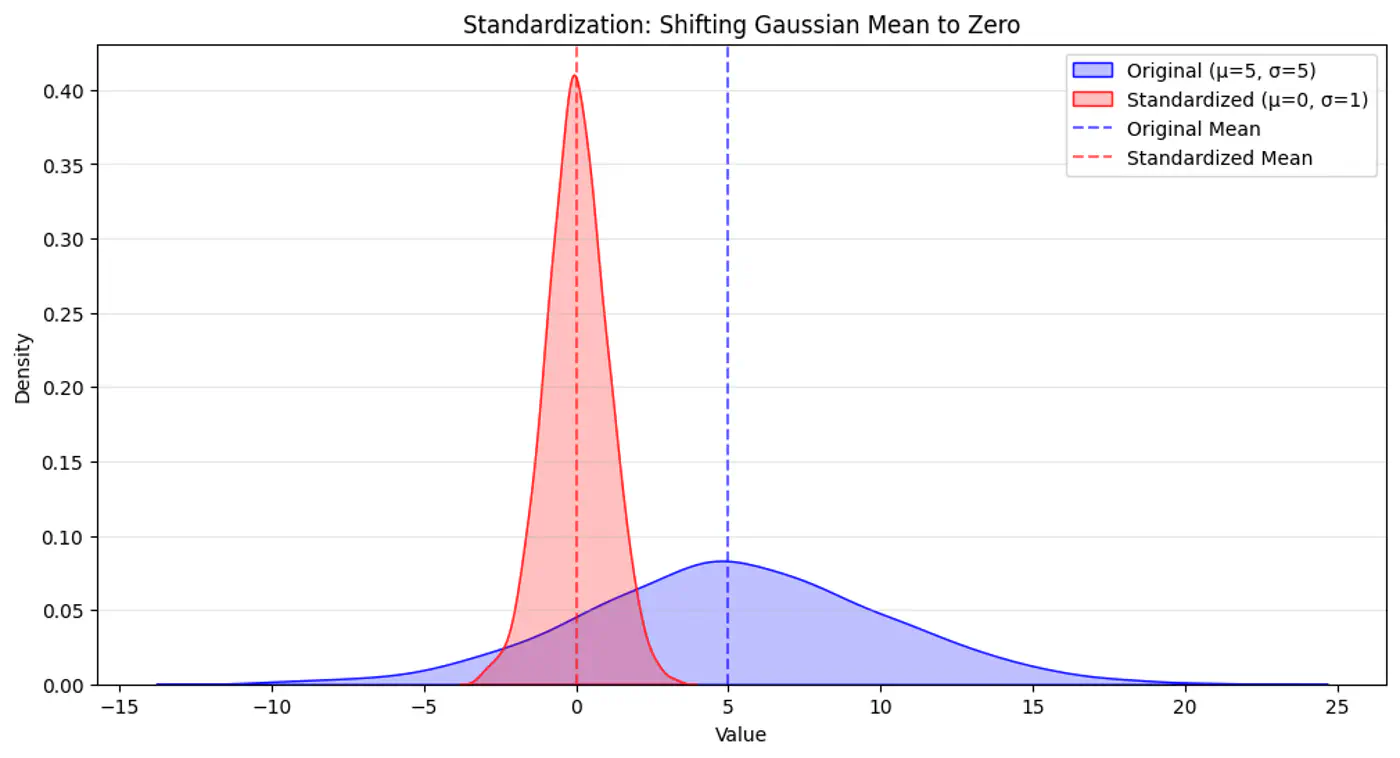
- Standardization (Z-score) :
- μ=0, σ=1; less sensitive to outliers.
- \(x_{std} = (x − μ) / σ\)
- Min-Max Normalization:
- Maps data to specific range, typically [0,1]; sensitive to outliers.
- \(x_{minmax} = (x − min) / (max − min)\)
- Robust Scaling:
- Transforms features using median and IQR; resilient to outliers.
- \(x_{scaled}=(x-\text{median})/\text{IQR}\)
👉 Standardization Example