Regression Metrics
Regression Metrics
2 minute read
Regression Metrics
Quantify the difference between the actual values and the predicted values.
Mean Absolute Error(MAE)
MAE = \(\frac{1}{n} \sum_{i=1}^n |y_i - \hat{y_i}|\)
- Treats each error equally.
- Robust to outliers.
- Not differentiable x=0.
- Using gradient descent requires computational hack.
- Easy to interpret, as same units as target variable.
Mean Squared Error(MSE)
MSE = \(\frac{1}{n} \sum_{i=1}^n (y_i - \hat{y_i})^2\)
- Heavily penalizes large errors.
- Sensitive to outliers.
- Differentiable everywhere.
- Used by gradient descent and most other optimization algorithms.
- Difficult to interpret, as it has squared units.
Root Mean Squared Error(RMSE)
RMSE = \(\sqrt{\frac{1}{n} \sum_{i=1}^n (y_i - \hat{y_i})^2}\)
- Easy to interpret, as it has same units as target variable.
- Useful when we need outlier-sensitivity of MSE but the interpretability of MAE.
R^2 Metric
Measures improvement over mean model.
\[ R^2 = 1 - \frac{SS_{res}}{SS_{tot}} = 1 - \frac{\sum_{i=1}^n (y_i - \hat{y_i})^2}{\sum_{i=1}^n (y_i - \bar{y_i})^2} \]Good R^2 value depends upon the use case, e.g. :
- Car 🚗 sale, R =0.8 is good enough.
- Cancer 🧪 prediction R 0.95, as life depends on it.
Range of values:
- Best value = 1
- Baseline value = 0
- Worst value = \(- \infty\)
Note: Example for bad model is all the points lie along x-axis and model predicts y-axis.
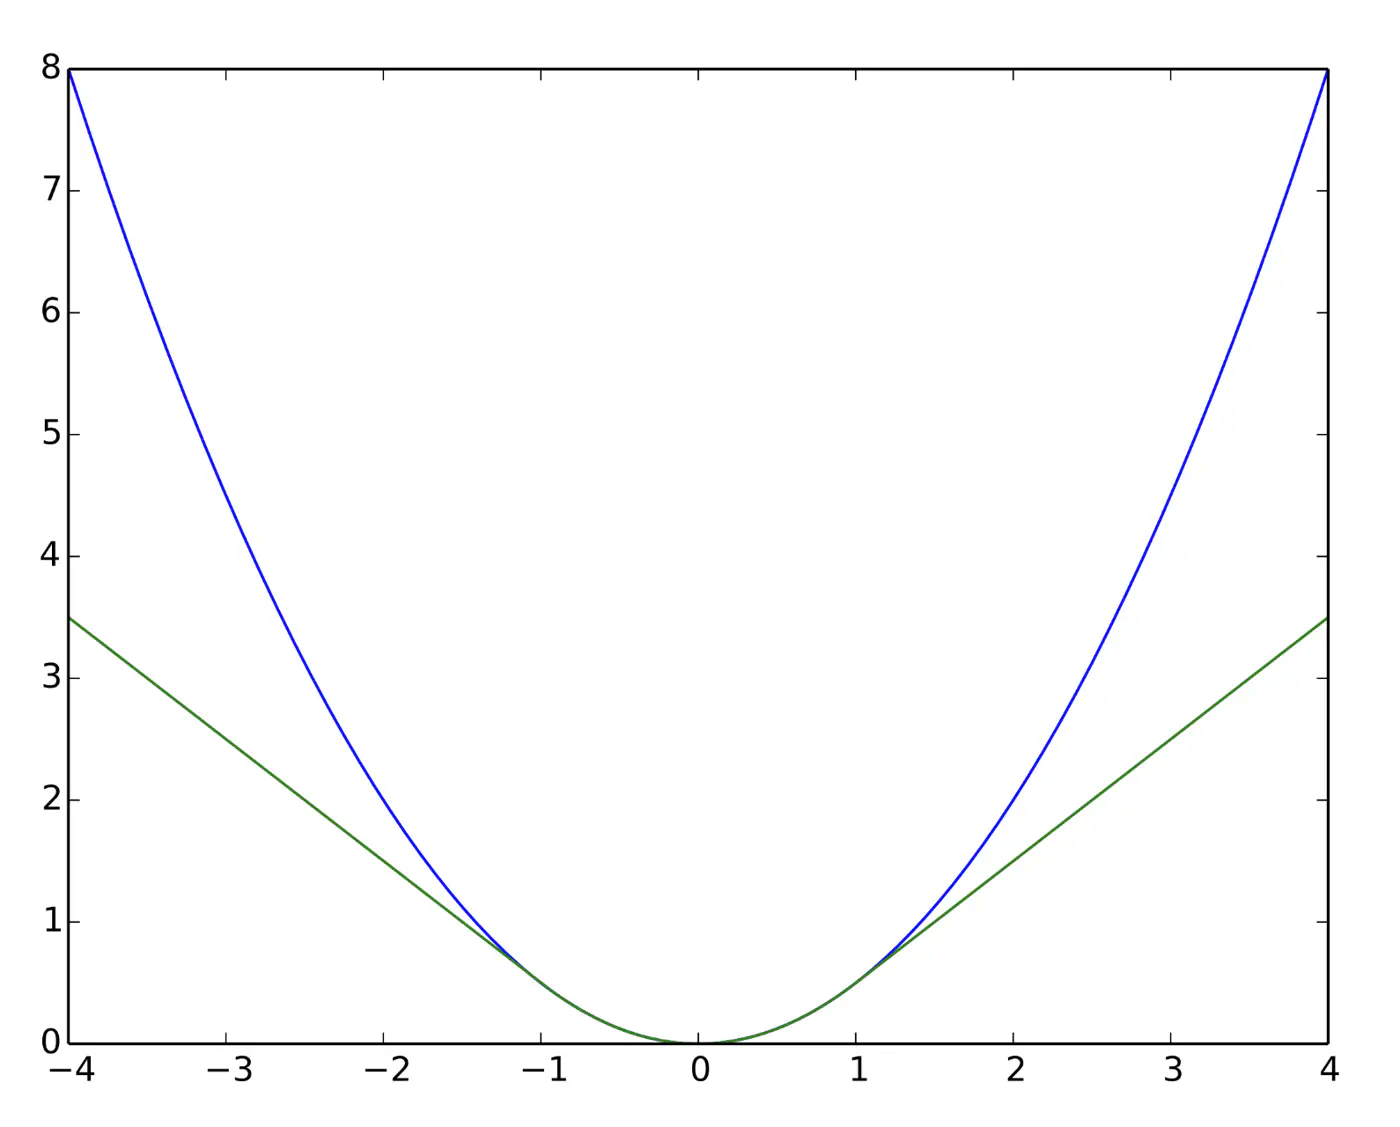
Huber Loss
Quadratic for small errors; Linear for large errors.
\[ L_{\delta}(y, \hat{y}) = \begin{cases} \frac{1}{2}(y - \hat{y})^2 & \text{for } |y - \hat{y}| \le \delta \\ \\ \delta (|y - \hat{y}| - \frac{1}{2}\delta) & \text{otherwise} \end{cases} \]- Robust to outliers.
- Differentiable at 0; smooth convergence to minima.
- Delta (\(\delta\)) knob(hyper parameter) to control.
- \(\delta\) high: MSE
- \(\delta\) low: MAE
Note: Tune \(\delta\): MAE, for outliers > \(\delta\); MSE, for small errors < \(\delta\).
e.g: = 95th percentile of errors or 1.35\(\sigma\) for standard Gaussian data.
Huber loss (Green) and Squared loss (blue)
End of Section