Binary Classification
Binary Classification
2 minute read
Binary Classification
Question
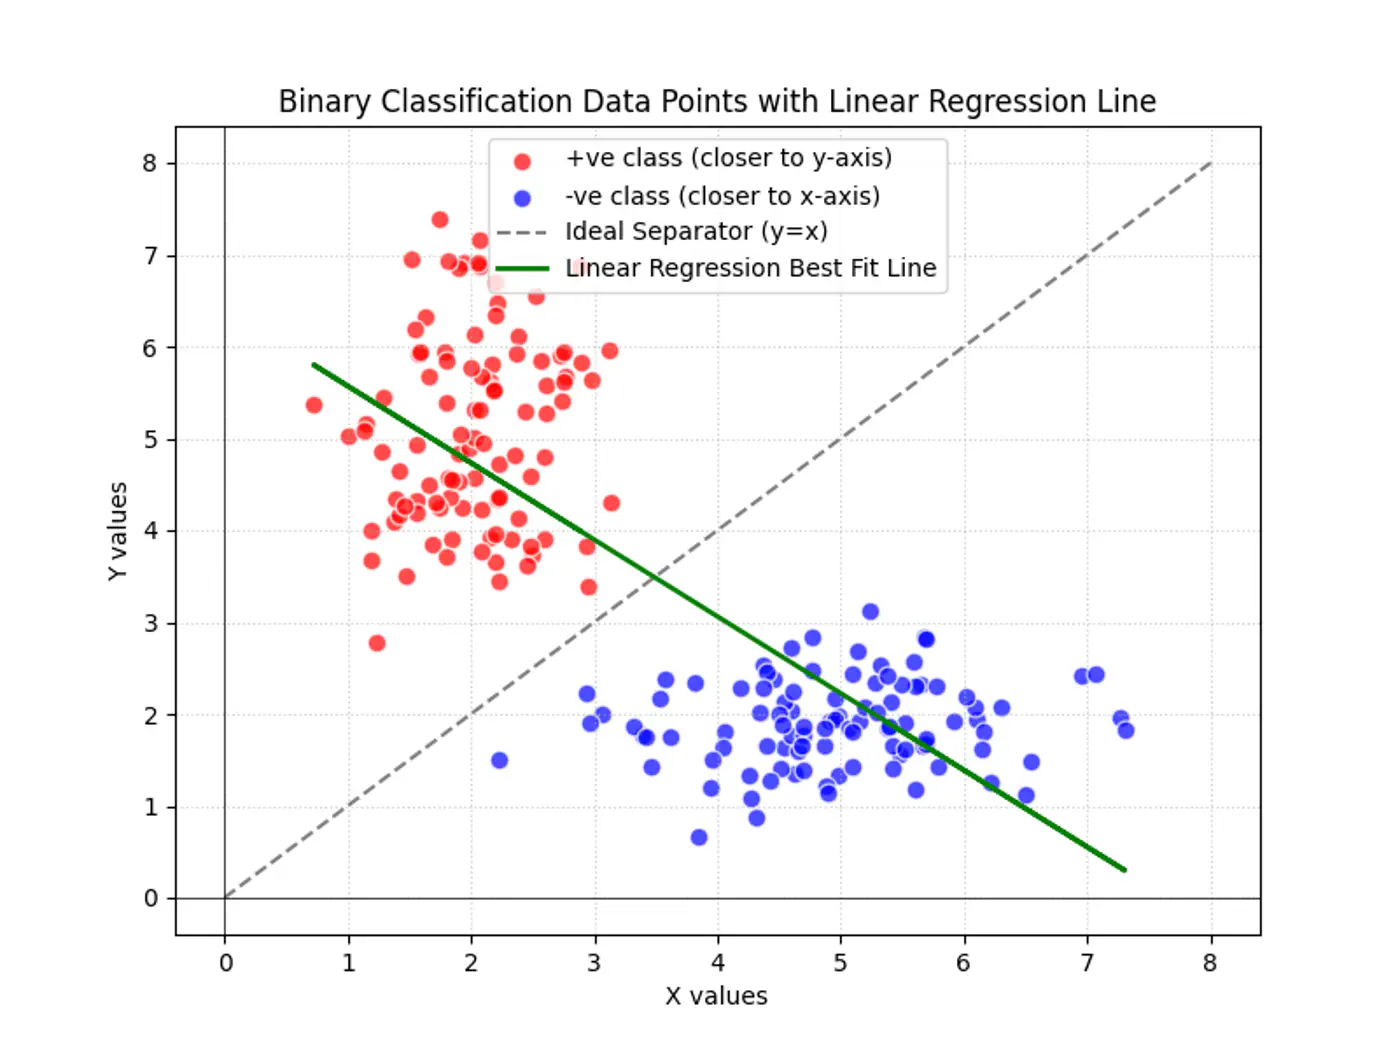
Why can’t we use Linear Regression for binary classification ?
Answer
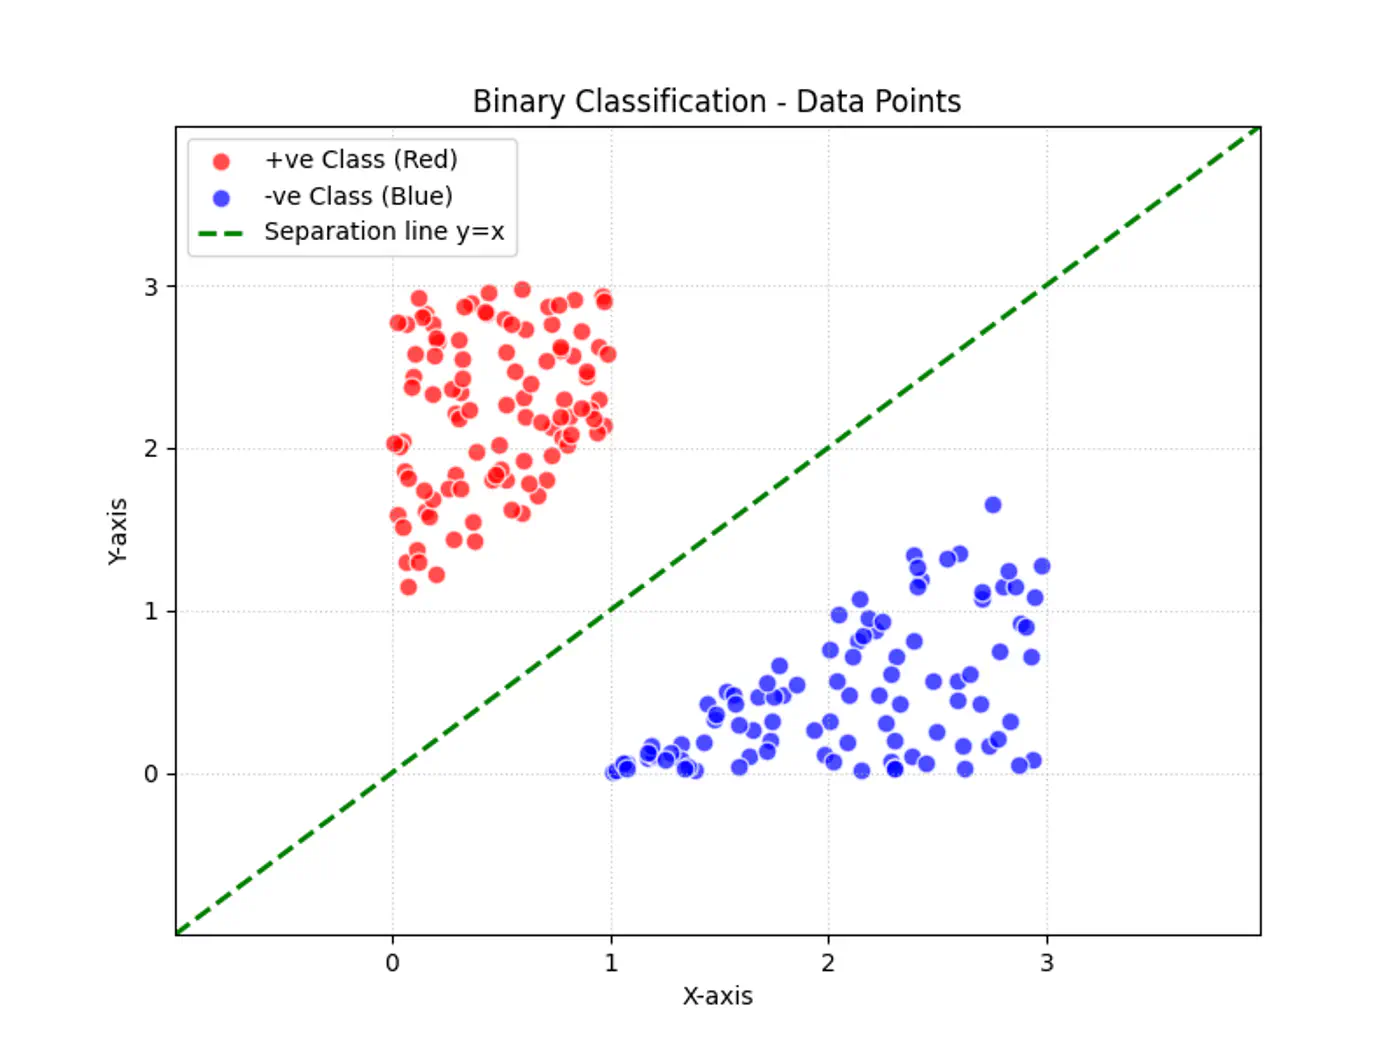
Linear regression tries to find the best fit line, but we want to find the line or decision boundary that clearly separates the two classes.
Goal 🎯
Find the decision boundary, i.e, the equation of the separating hyperplane.
\[z=w^{T}x+w_{0}\]Decision Boundary
Value of \(z = \mathbf{w^Tx} + w_0\) tells us how far is the point from the decision boundary and on which side.
Note: Weight 🏋️♀️ vector ‘w’ is normal/perpendicular to the hyperplane, pointing towards the positive class (y=1).
Distance of Points from Separating Hyperplane
- For points exactly on the decision boundary \[z = \mathbf{w^Tx} + w_0 = 0 \]
- Positive (+ve) labeled points \[ z = \mathbf{w^Tx} + w_0 > 0 \]
- Negative (-ve) labeled points \[ z = \mathbf{w^Tx} + w_0 < 0 \]
Missing Link 🔗
The distance of a point from the hyperplane can range from \(-\infty\) to \(+ \infty\).
So we need a link 🔗 to transform the geometric distance to probability.
So we need a link 🔗 to transform the geometric distance to probability.
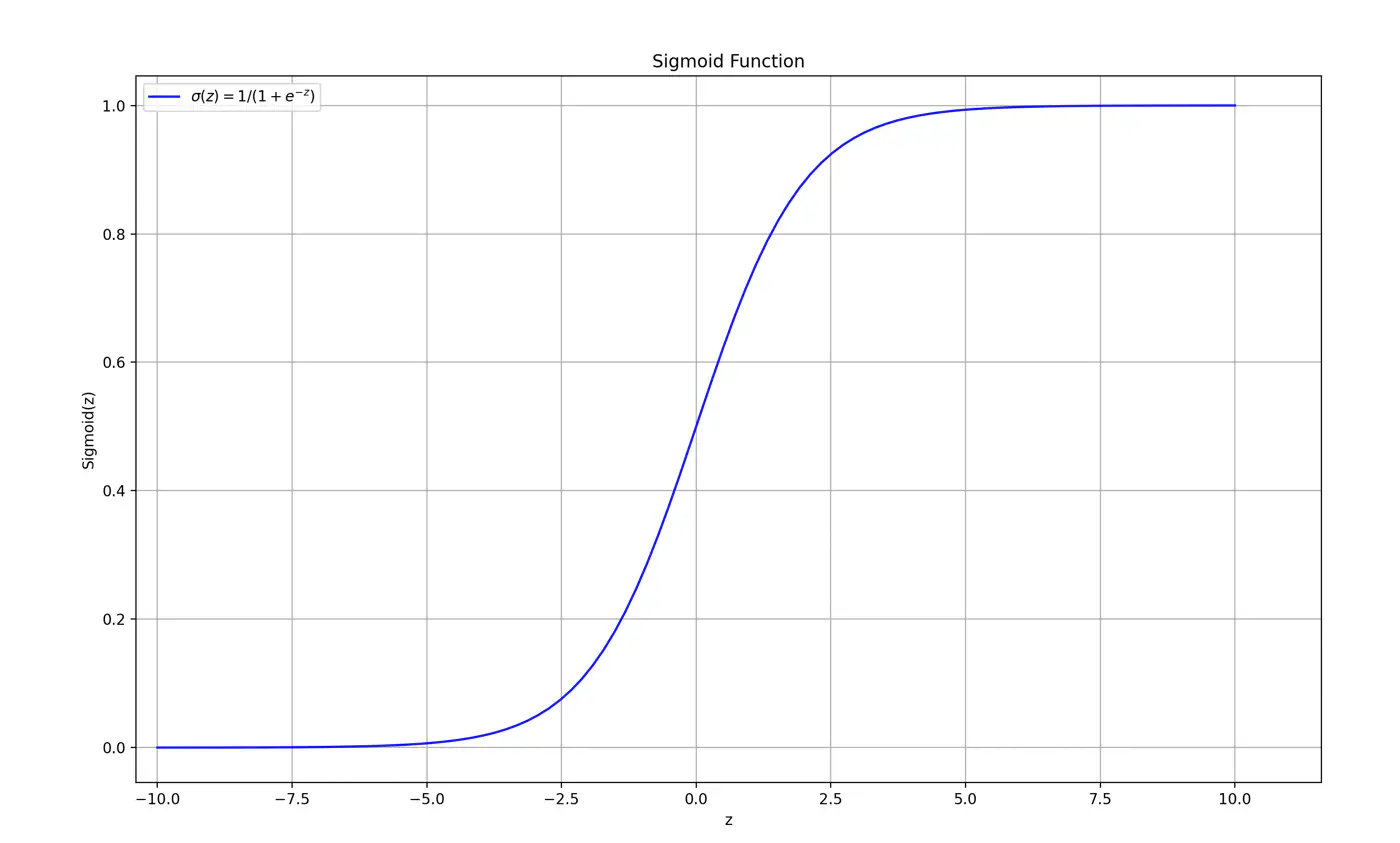
Sigmoid Function (a.k.a Logistic Function)
Maps the output of a linear equation to a value between 0 and 1, allowing the result to be interpreted as a probability.
\[\hat{y} = \sigma(z) = \frac{1}{1 + e^{-z}}\]If the distance ‘z’ is large and positive, \(\hat{y} \approx 1\) (High confidence).
If the distance ‘z’ is 0, \(\hat{y} = 0.5\) (Maximum uncertainty).
Why is it called Logistic Regression ?
Because, we use the logistic (sigmoid) function as the ‘link function’🔗 to map 🗺️ the continuous output of the regression into a probability space.
End of Section