RANSAC
RANSAC
2 minute read
Use Case 🐝
⭐️Estimate the parameters of a model from a set of observed data that contains a significant number of outliers.
Intuition 💡
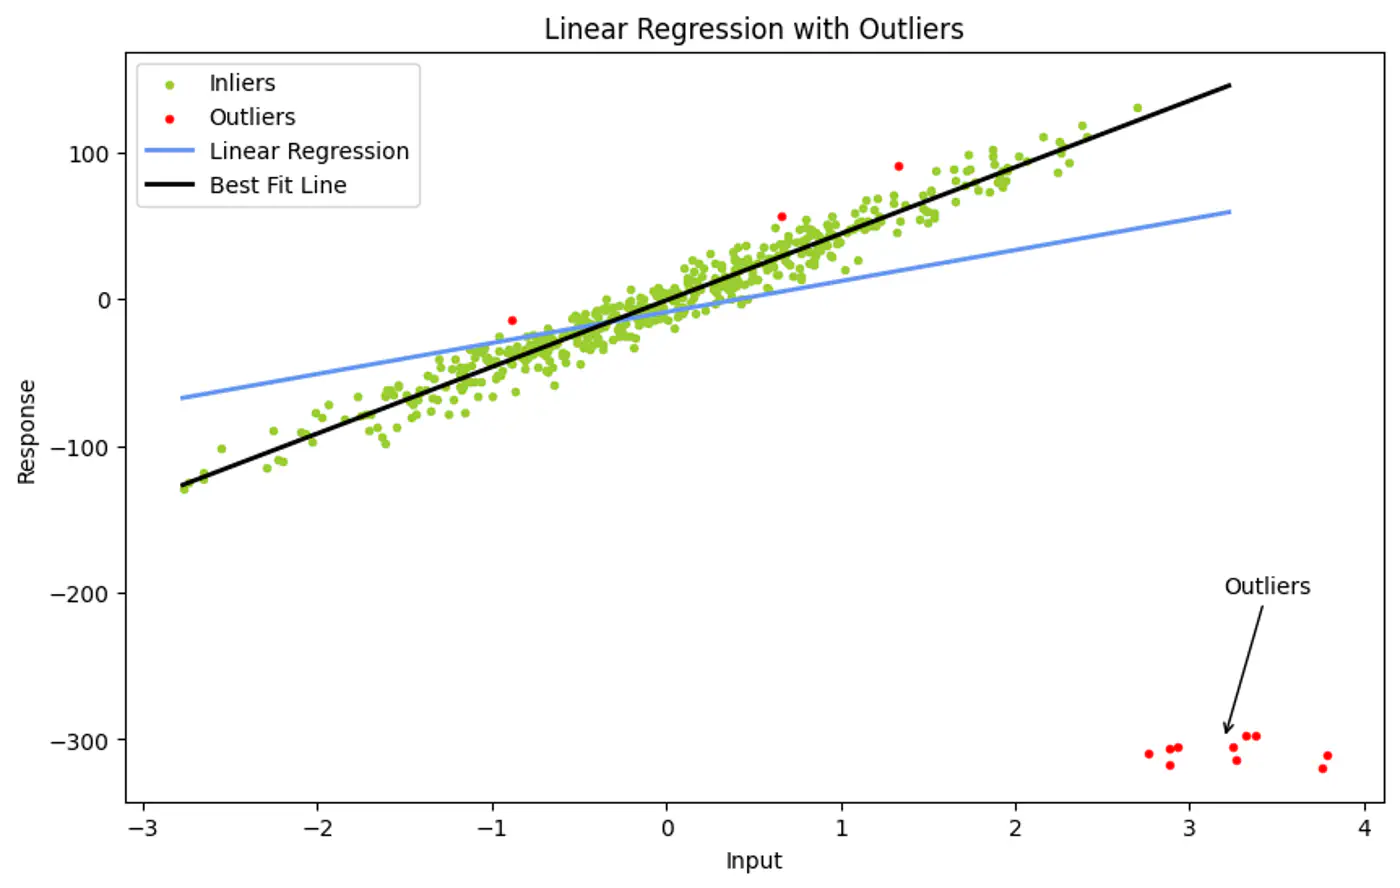
👉Ordinary Least Squares use all data points to find a fit.
- However, a single outlier can ‘pull’ the resulting line significantly, leading to a poor representative model.
💡If we pick a very small random subset of points, there is a higher probability that this small subset contains only good data (inliers) compared to a large set.
Problem 🦀
Ordinary Least Squares (OLS) minimizes the Sum of Errors.
- A huge outlier has an exponentially large impact on the final line.
Solution 🦉
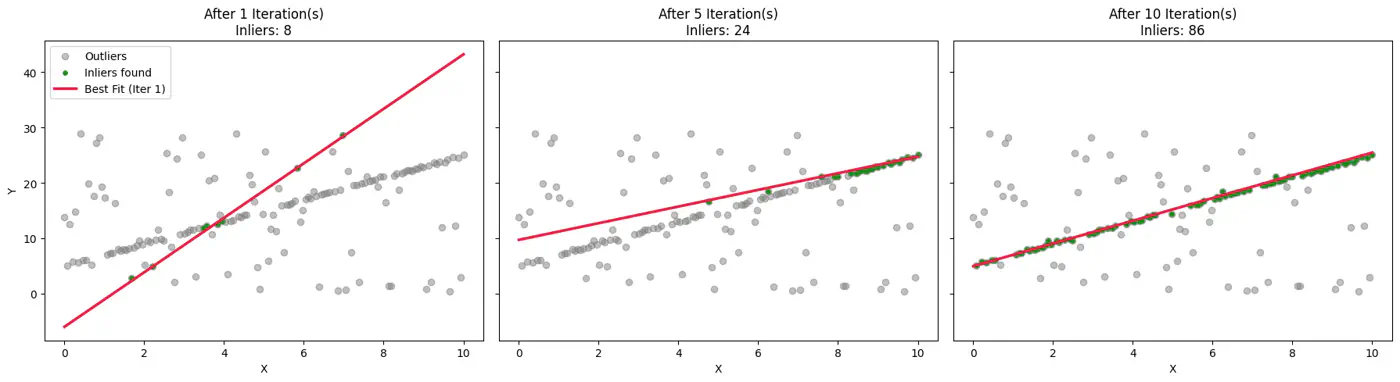
💡Instead of using all points, iteratively pick the smallest possible random subset to fit a model, then check (votes) how many other points in the dataset ‘agree’ with that model.
This gives the name to our algorithm:
- Random: Random subsets.
- Sampling: Small subsets.
- Consensus: Agreement with other points.
RANSAC Algorithm ⚙️
- Random Sampling:
- Randomly select a Minimal Sample Set (MSS) of ’n’ points from the input data ‘D’.
- e.g. n=2 for a line, or n=3 for a plane in 3D.
- Model Fitting:
- Compute the model parameters using only these ’n’ points.
- Test:
- For all other points in ‘D’, calculate the error relative to the model.
- 👉 Points with error < \(\tau\)(threshold) are added to the ‘Consensus Set’.
- Evaluate:
- If the consensus set is larger than the previous best, save this model and set.
- Repeat 🔁:
- Iterate ‘k’ times.
- Refine (Optional):
- Once the best model is found, re-estimate it using all points in the final consensus set (usually via Least Squares) for a more precise fit.
👉Example:
How Many Iterations ‘k’ ?
👉To ensure the algorithm finds a ‘clean’ sample set (no outliers) with a desired probability(often 99%), we use the following formula:
\[k=\frac{\log (1-P)}{\log (1-w^{n})}\]- k: Number of iterations required.
- P: Probability that at least one random sample contains only inliers.
- w: Ratio of inliers in the dataset (number of inliers / total points).
- n: Number of points in the Minimal Sample Set.
End of Section