PCA
3 minute read
- Data Compression
- Noise Reduction
- Feature Extraction: Create a smaller set of meaningful features from a larger one.
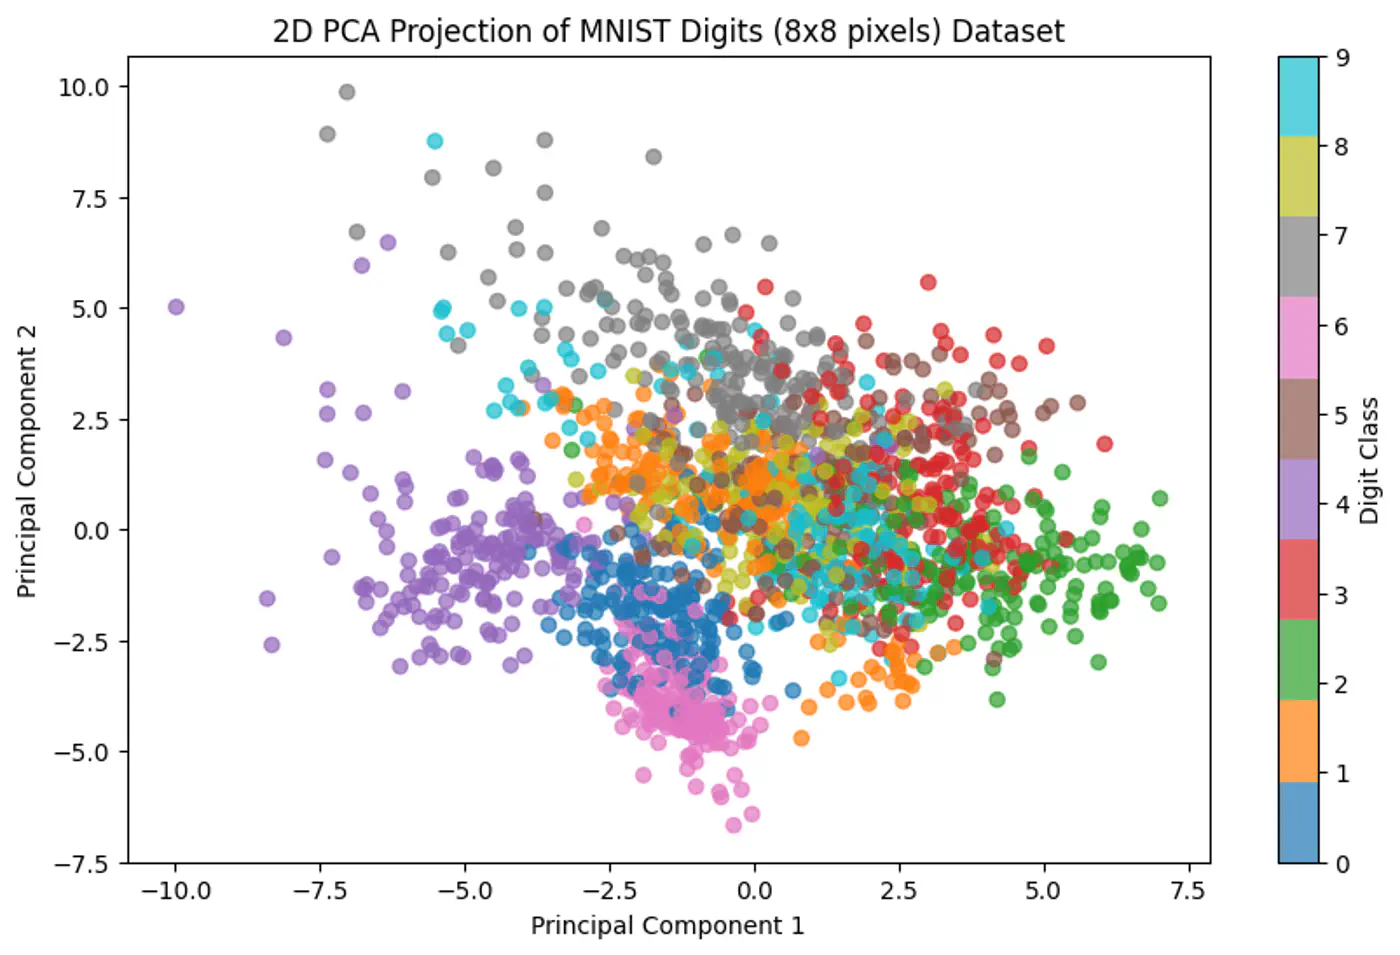
- Data Visualization: Project high-dimensional data down to 2 or 3 dimensions.
Assumption: Linear relationship between features.
💡‘Information = Variance’
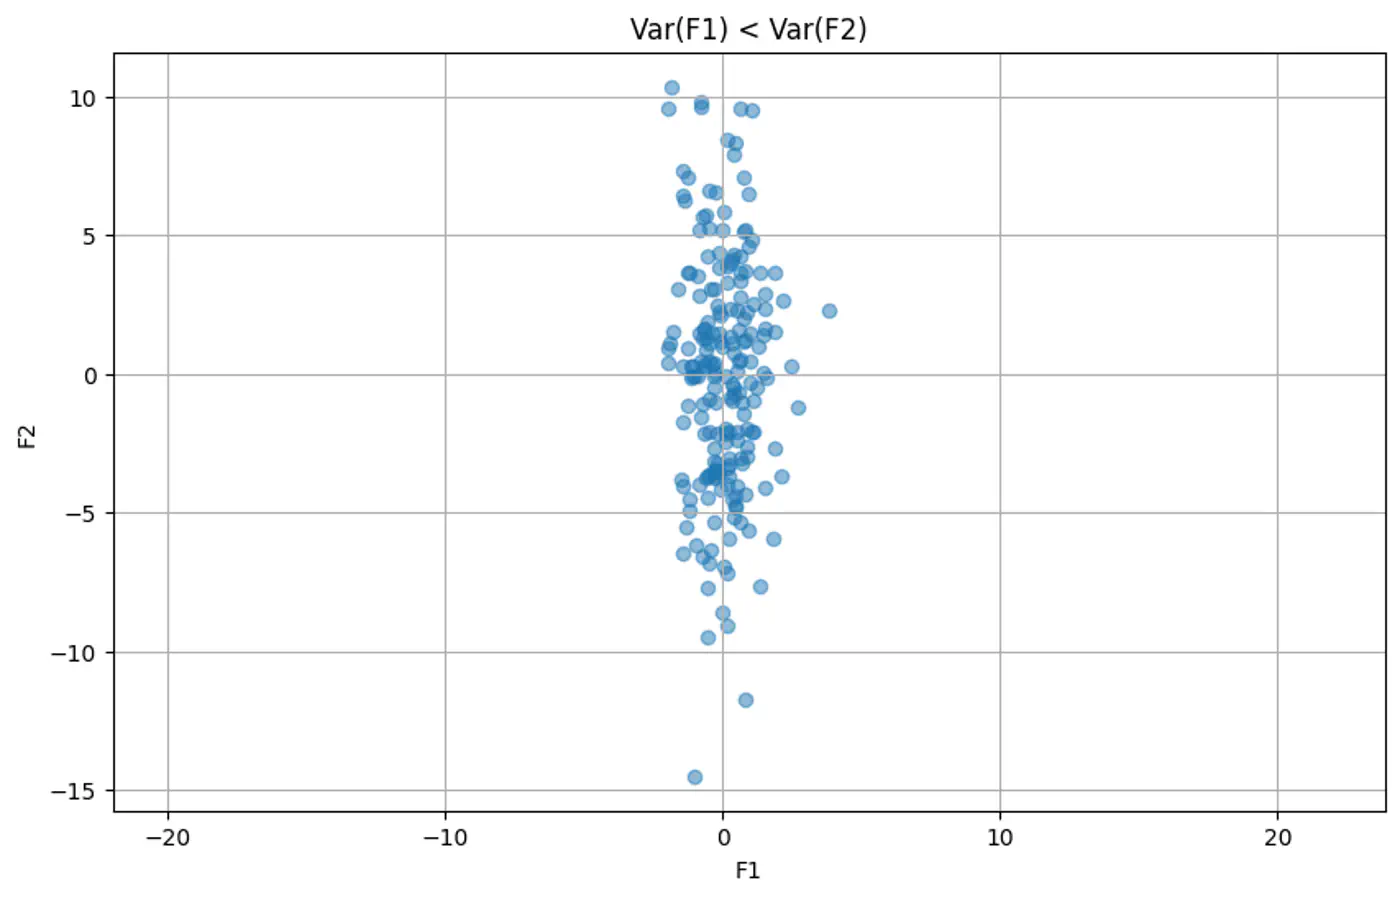
☁️ Imagine a cloud of points in 2D space.
👀 Look for the direction (axis) along which the data is most ‘spread out’.
🚀 By projecting data onto this axis, we retain the maximum amount of information (variance).
👉Example 1: Var(Feature 1) < Var(Feature 1)
👉Example 2: Red line shows the direction of maximum variance
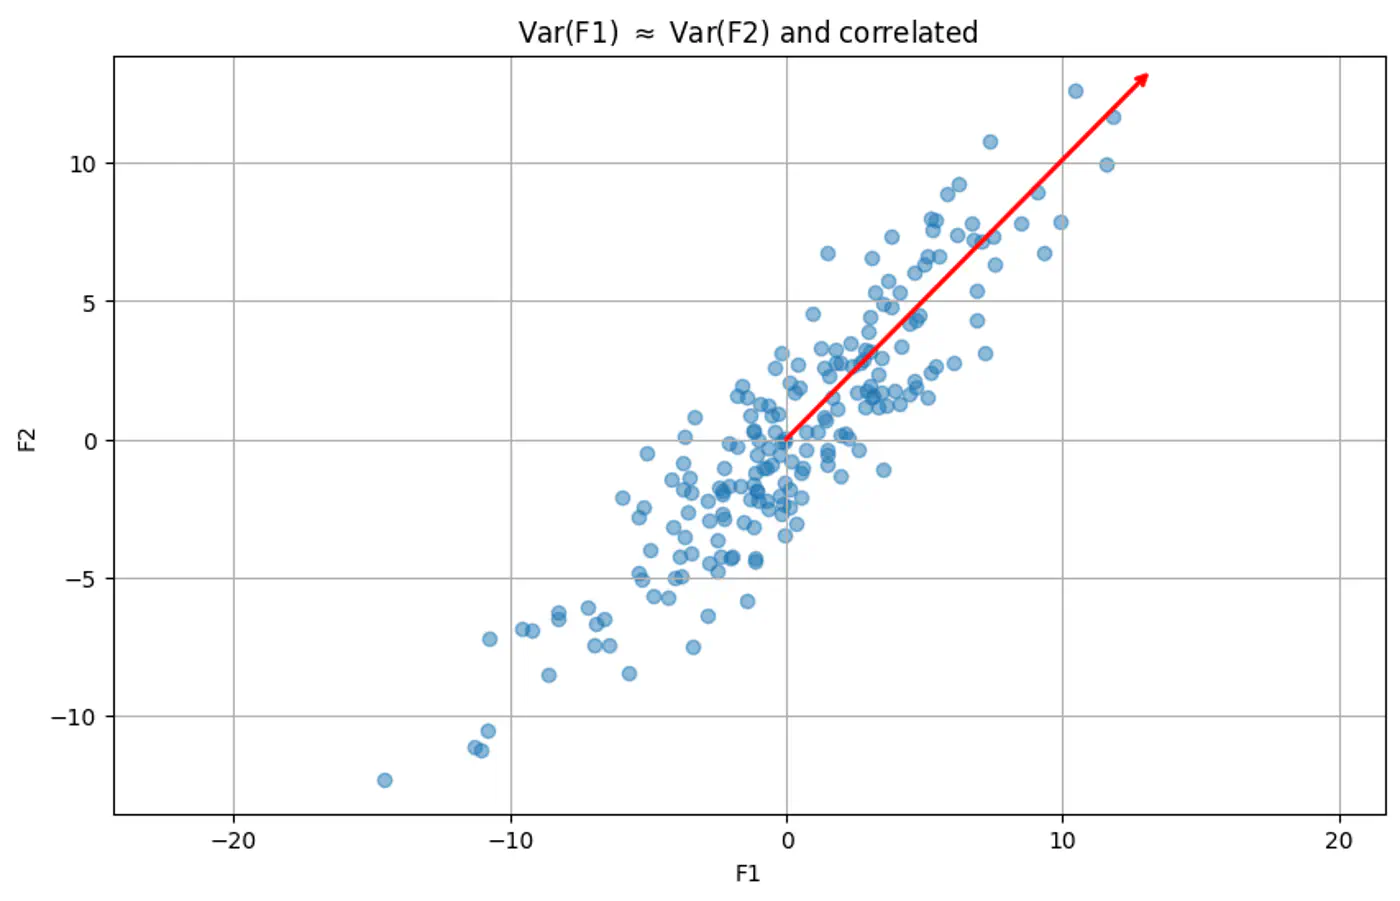
🧭 Finds the direction of maximum variance in the data.
Note: Some loss of information will always be there in dimensionality reduction, because there will be some variability in data along the direction that is dropped, and that will be lost.
- PCA seeks a direction 🧭, represented by a unit vector \(\hat{u}\) onto which data can be projected to maximize variance.
- The projection of a mean centered data point \(x_i\) onto \(u\) is \(u^Tx_i\).
- The variance of these projections can be expressed as \(u^{T}\Sigma u\), where \(\Sigma\) is the data’s covariance matrix.
- Data: Let \(X = \{x_{1},x_{2},\dots ,x_{n}\}\) is the mean centered (\(\bar{x} = 0\)) dataset.
- Projection of point \(x_i\) on \(u\) is \(z_i = u^Tx_i\)
- Variance of projected points (since \(\bar{x} = 0\)): \[\text{Var}(z)=\frac{1}{n}\sum _{i=1}^{n}z_{i}^{2}=\frac{1}{n}\sum _{i=1}^{n}(x_{i}^{T}u)^{2}\]
- 💡Since, \((x_{i}^{T}u)^{2} = (u^{T}x_{i})(x_{i}^{T}u)\) \( \implies\text{Var}(z)=u^{T}\left(\frac{1}{n}\sum _{i=1}^{n}x_{i}x_{i}^{T}\right)u\)
- 💡Since, Covariance Matrix, \(\Sigma = \left(\frac{1}{n}\sum _{i=1}^{n}x_{i}x_{i}^{T}\right)\)
- 👉 Therefore, \(\text{Var}(z)=u^{T}\Sigma u\)
👉 To prevent infinite variance, PCA constrains \(u\) to be a unit vector (\(\|u\|=1\)).
\[\text{maximize\ }u^{T}\Sigma u, \quad \text{subject\ to\ }u^{T}u=1\]Note: This constraint forces the optimization algorithm to focus purely on the direction that maximizes variance, rather than allowing it to artificially inflate the variance by increasing the length of the vector.
⏲️ Lagrangian function: \(L(u,\lambda )=u^{T}\Sigma u-\lambda (u^{T}u-1)\)
🔦 To find \(u\) that maximizes above constrained optimization:
💎 This is the standard Eigenvalue Equation.
🧭 So, the optimal directions \(u\) are the eigenvectors of the covariance matrix \(\Sigma\).
👉 To see which eigenvector maximizes variance, substitute the result back into the variance equation:
\[\text{Variance}=u^{T}\Sigma u=u^{T}(\lambda u)=\lambda (u^{T}u)=\lambda \]🧭 Since the variance equals the eigenvalue \(\lambda\), the direction \(u\) that maximizes variance is the eigenvector associated with the largest eigenvalue.
- Center the data: \(X = X - \mu\)
- Compute the Covariance Matrix: \(\Sigma = \frac{1}{n-1} X^T X\)
- Compute Eigenvectors and Eigenvalues of \(\Sigma\) .
- Sort eigenvalues in descending order and select the top ‘k’ eigenvectors.
- Project the original data onto the subspace: \(Z = X W_k\) where, \(W_{k}=[u_{1},u_{2},\dots ,u_{k}]\) , matrix formed by ‘k’ eigenvectors corresponding to ‘k’ largest eigenvalues.
- Cannot model non-linear relationships.
- Sensitive to outliers.
End of Section