Silhouette Score
3 minute read
- ✅ Elbow Method: Quickest to compute; good for initial EDA.
- ✅ Dunn Index: Focuses on the ‘gap’ between the closest clusters.
——- We have seen the above 2 methods in the previous section ———- - 👉 Silhouette Score: Balances compactness and separation.
- 👉 Domain specific knowledge and system constraints.
⭐️Clustering quality evaluation metric that measures how similar a data point is to its own cluster (cohesion) compared to other clusters (separation).
Note: Higher scores (closer to 1) indicate better-defined, distinct clusters, while scores near 0 suggest overlapping clusters, and negative scores mean points might be in the wrong cluster.
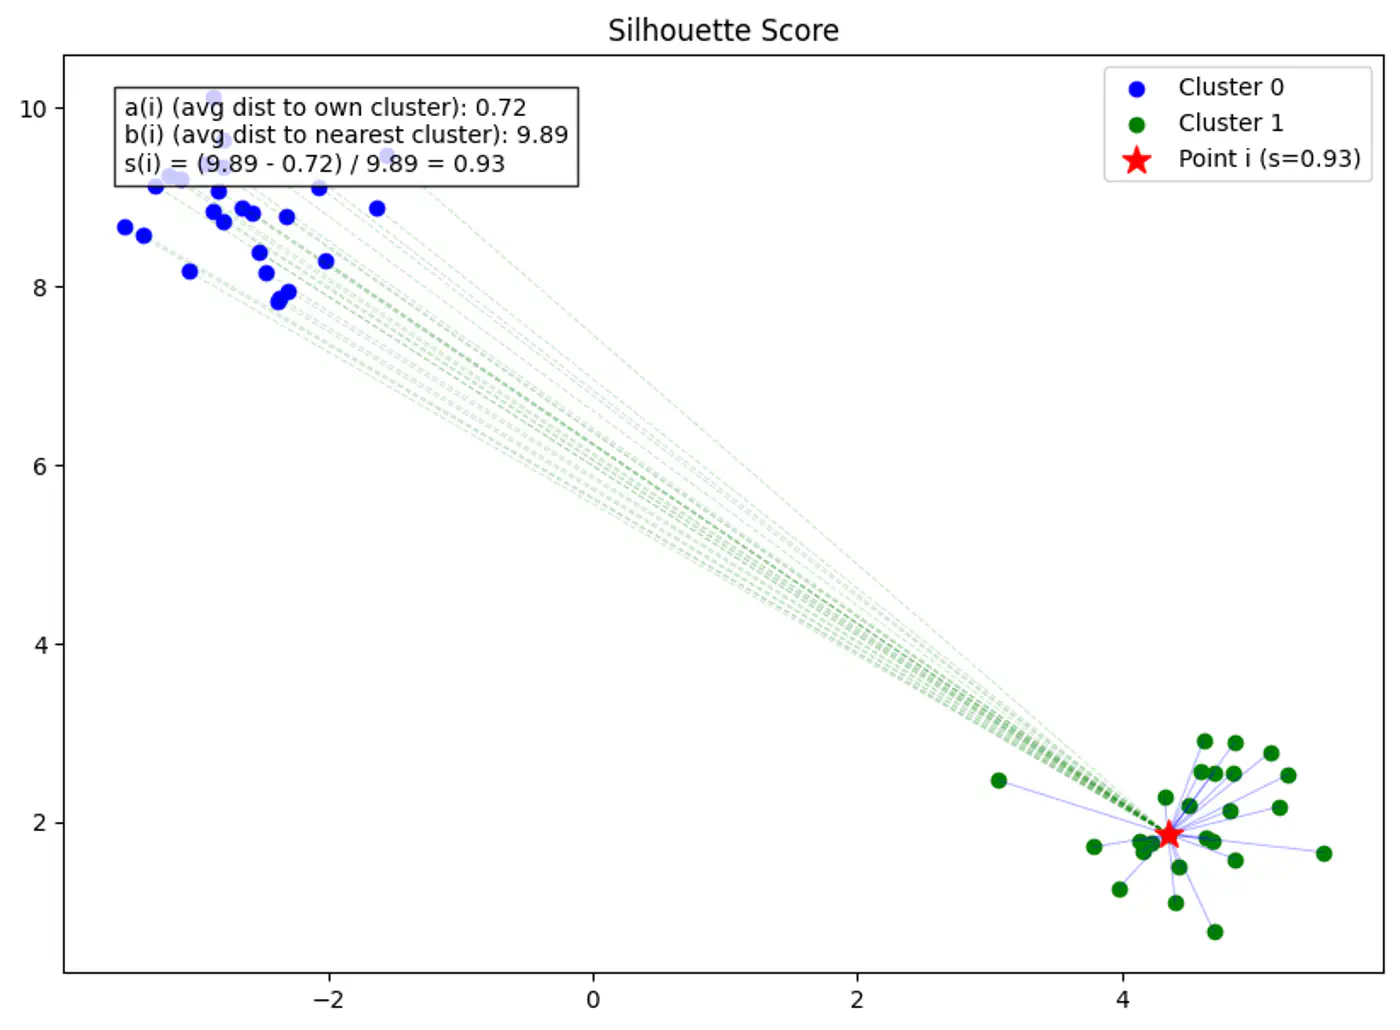
Silhouette score for point ‘i’ is the difference between separation b(i) and cohesion a(i), normalized by the larger of the two.
\[ s(i) = \frac{b(i) - a(i)}{\max(a(i), b(i))} \]Note: The Global Silhouette Score is simply the mean of s(i) for all points in the dataset.
👉Example for Silhouette Score:
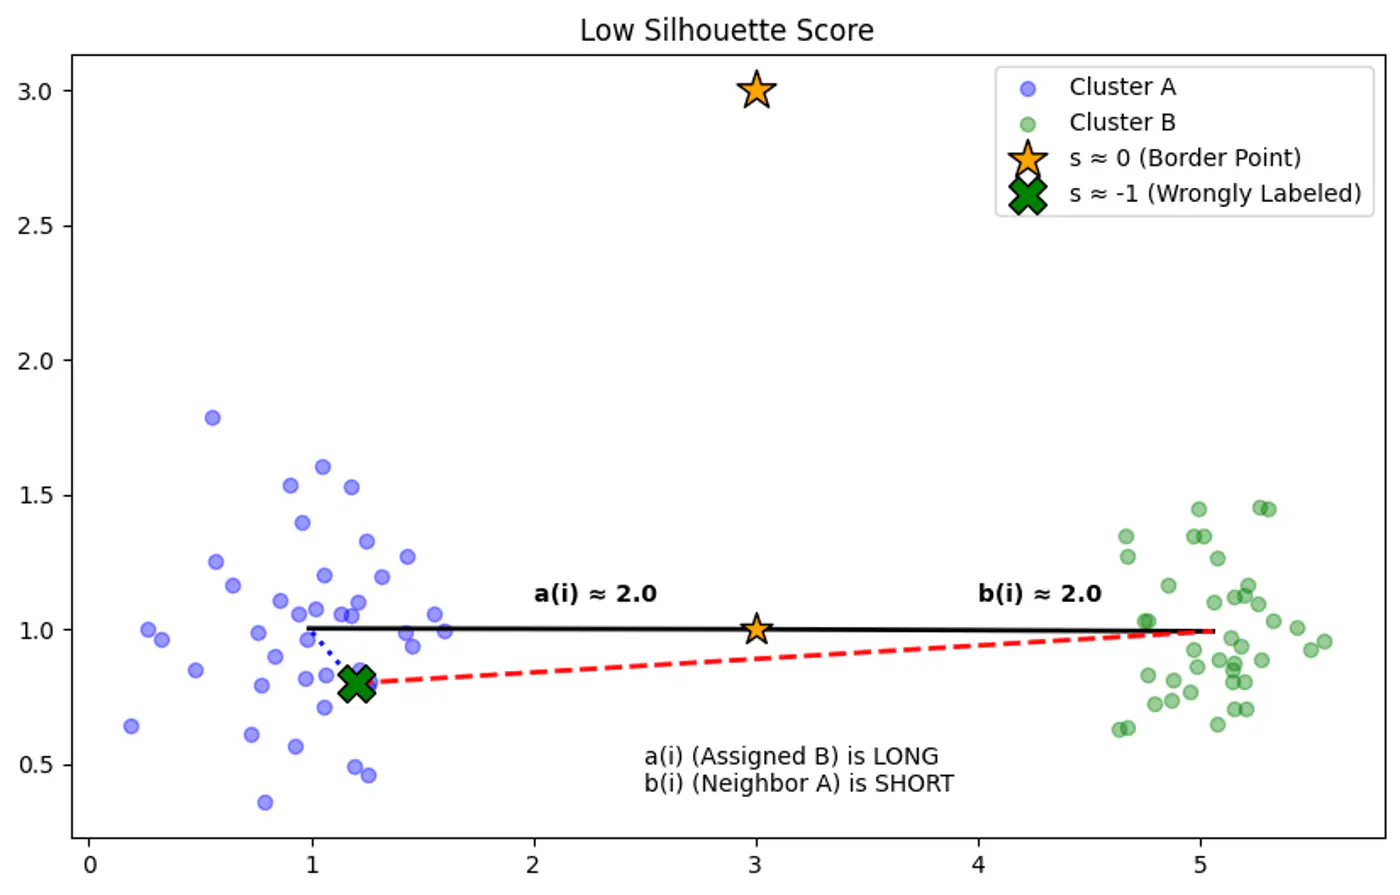
👉Example for Silhouette Score of 0(Border Point) and negative(Wrong Cluster).
🦉Now let’s understand the terms in Silhouette Score in detail.
Average distance between point ‘i’ and all other points in the same cluster.
\[a(i) = \frac{1}{|C_A| - 1} \sum_{j \in C_A, i \neq j} d(i, j)\]Note: Lower a(i) means the point is well-matched to its own cluster.
Average distance between point ‘i’ and all points in the nearest neighboring cluster (the cluster that ‘i’ is not a part of, but is closest to).
\[b(i) = \min_{C_B \neq C_A} \frac{1}{|C_B|} \sum_{j \in C_B} d(i, j)\]Note: Higher b(i) means the point is very far from the next closest cluster.
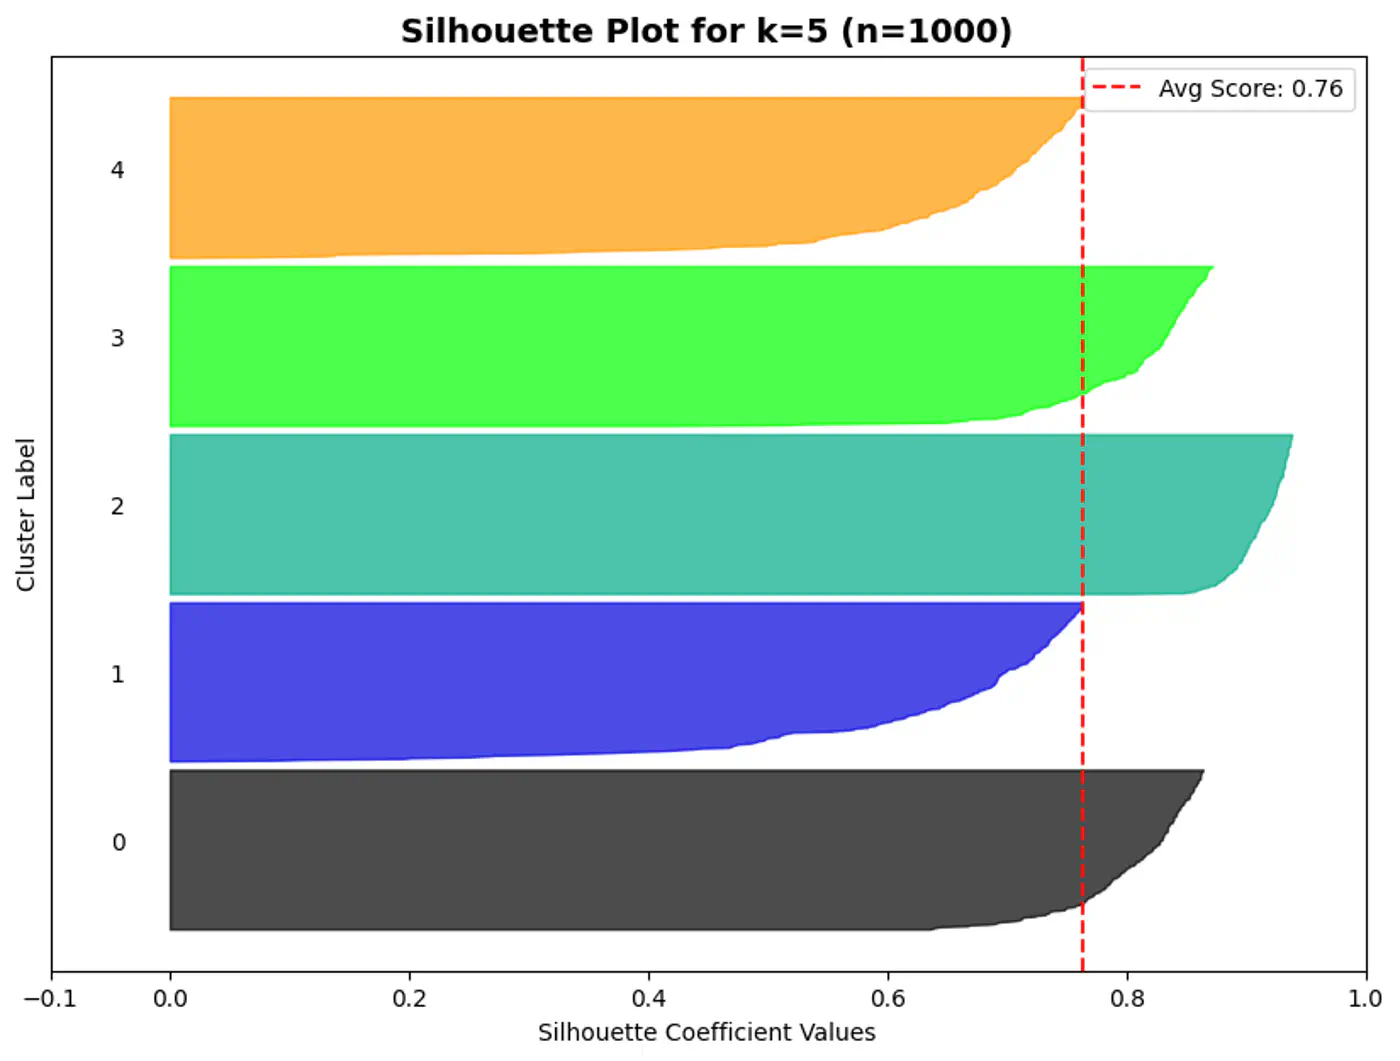
⭐️A silhouette plot is a graphical tool used to evaluate the quality of clustering algorithms (like K-Means), showing how well each data point fits within its cluster.
👉Each bar gives the average silhouette score of the points assigned to that cluster.
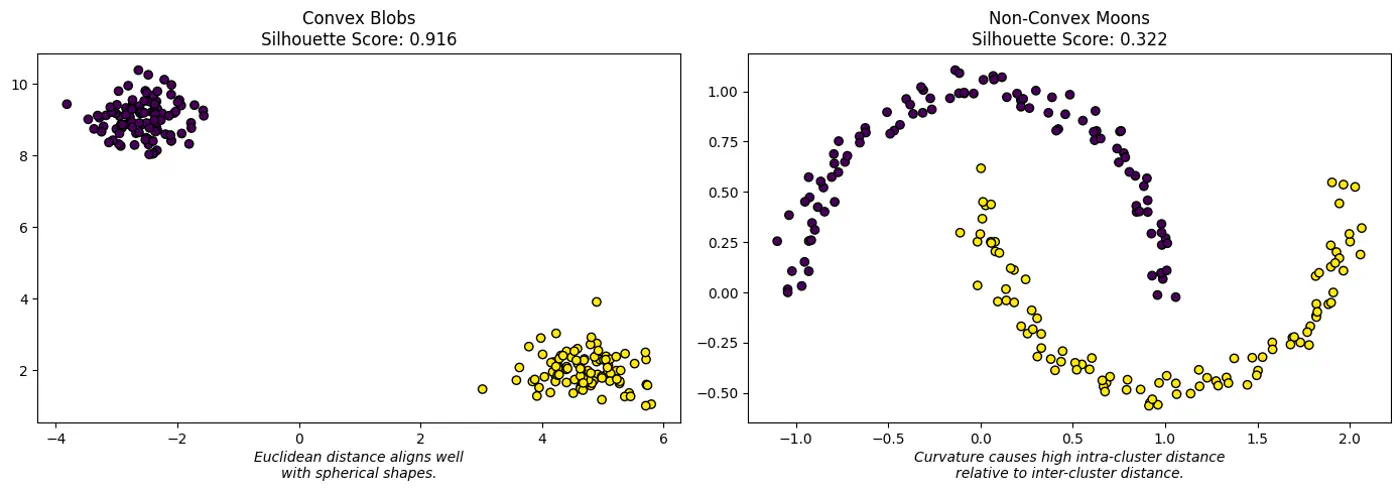
⛳️ Like K-Means, the Silhouette Score (when using Euclidean distance) assumes convex clusters.
🌘 If we use it on ‘Moon’ shaped clusters, it will give a low score even if the clusters are perfectly separated, because the ‘average distance’ to a neighbor might be small due to the curvature of the manifold.
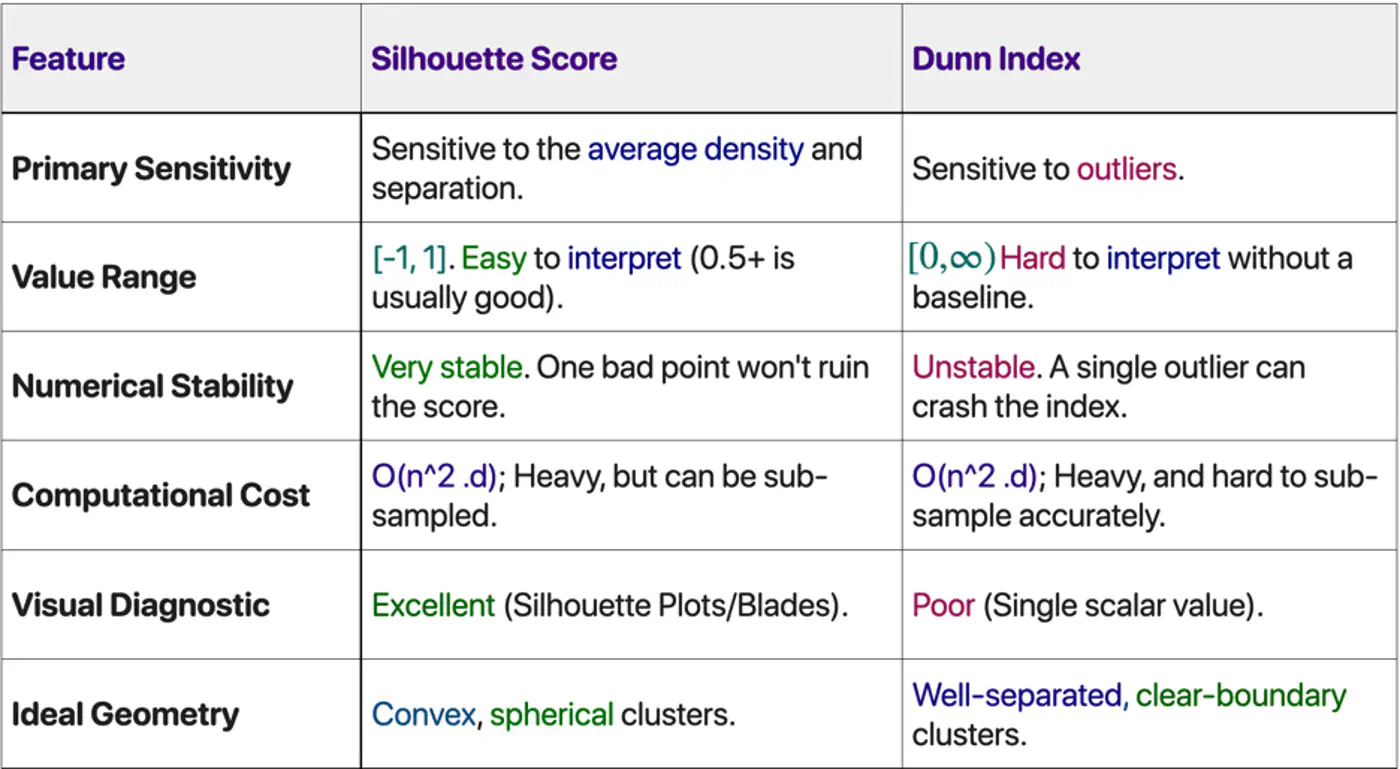
Choose Silhouette Score if:
✅ Need a human-interpretable metric to present to stakeholders.
✅ Dealing with real-world noise and overlapping ‘fuzzy’ boundaries.
✅ Want to see which specific clusters are weak (using the plot).
Choose Dunn Index if:
✅ Performing ‘Hard Clustering’ where separation is a safety or business requirement.
✅ Data is pre-cleaned of outliers (e.g., in a curated embedding space).
✅ Need to compare different clustering algorithms (e.g., K-Means vs. DBSCAN) on a high-integrity task.
End of Section